On perseverance
As part of trying to convince myself to commit to my next project I spent some time wondering just what it might mean if the project really is beyond my abilities. At what point does it make sense to say “don’t even try in the first place?” or “okay, you’ve given it a fair shot, don’t throw good money/time/whatever after bad” or “pshaw, don’t be a quitter”?
Most of the time that’s not terribly hard — you work out if it’s within your abilities, and if it’s not you don’t bother, and if it is, you do it, figure out if you made any mistakes and fix them, and take a bow. But when you get to the very edge of what you’re capable of, just fixing your mistakes can be complicated enough that you can make mistakes there too, and if you make more mistakes fixing those…
Back in high school, we had a few ex-students return as speakers every now and then to tell us how they were Rhodes Scholars or otherwise awesome and how we could be almost as awesome if we studied hard and listened to our teachers. Okay, I’m not sure if they actually said that — but presumably they did. All I really remember from any of them was a general vibe of “success isn’t easy, it takes a lot of hard work, and not giving up, even when it seems sensible to give up”.
But having also been playing with gnuplot lately, I figured why not quantify that? Take two parameters, s representing how smart you are (or, more particularly, the probability you will succeed on any particular attempt), and p representing how likely you are to persevere (or the probability that having just failed you’ll try again anyway).
Your probability of ultimate success, assuming you try, is then, S, is s+(1-s)pS, which, if you do the maths, works out to be s/(sp+1-p). What does that mean? Well, that’s where graphs come in:
gnuplot> set isosample 21
gnuplot> set hidden3d
gnuplot> set xrange[0:1]
gnuplot> set yrange[0:1]
gnuplot> set zrange[0:100.1]
gnuplot> S(s,p) = s/(s*p+1-p)
gnuplot> splot S(x,y) * 100, 90

That gives you a red curve representing the percentage change you’ll succeed for a given level of smarts and perseverance, and a blue plane at 90%. One thing you can see from that is with zero perseverance (you’ll try once, but never again), you have a straight line matching your smarts. And you’ll have a 100% chance of success if either you’ve got a 100% smartness level (you’ll always get it first time), or you’ve got a non-zero smartness (some chance of success) and 100% perseverance (you’ll never give up ’til you succeed).
But perseverance as a probability like that isn’t very meaningful; a more intuitive idea is how many attempts you’ll make — just one or two, or ten or twenty, or a hundred? You can relate perseverance and number of attempts, n with a forumula like P(n,p) = pn where P(n,p) gives you the probability of making at least n attempts given a perseverance of p. Going for a probability of at least 90%, and rearranging gives p=0.91/n. 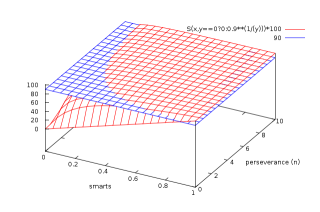
That graph looks very different — and given how much of the red is above the blue, a lot more promising. And the reason is pretty simple — in this graph, 90% of the space (from n=1 to 10) is assuming there’s a 90% chance you’ll have two or more attempts, whereas in the previous graph, 90% of the space (from p=0.0 to 0.9) was assuming there was less than 90% chance of having a second attempt. For p=0.5 half the time you’ll give up after the first time, and, on average, you’ll make just two attempts in total.
Of course, if you make fifty attempts, and finally succeed, does that mean you’ve been very persistent (p≥0.986 probably), or does it mean you’re a huge loser (98% failure average)? Or both? That’s not immaterial. If you’re in a casino, and you stake $10 for every attempt, then your final success better pay off around $500 or more, or you’re still a loser at the end of the day. And of course, casinos don’t generally stay in business if the $10 stakes don’t add up faster than the $500 payouts. So your perseverance better not have been set at a higher value than the cost/benefit ends up warranting.
And there’s another problem too — your liklihood of success after a hundred attempts isn’t the same as your chance of success on your first go. If all your attempts so far have failed, then there better be something different about your next attempt, or your chance of success is probably zero (cf the saying “insanity is doing the same thing, over and over again, but expecting different results”). And if you’ve tried a hundred times, you chances of coming up with something new yourself is probably pretty low. And worse, that’s a lot of opportunities to build up some bad habits that also lower your chances.
On the other hand, after that many attempts, you’ve probably learnt a thing or two — at the very least, you’ve found a hundred ways that don’t work, and if your problem’s at all complicated, you’ve probably had a few minor successes that might be directly useful as well. And hey, maybe you’ll pick up on something in the process of failing that’ll give you a new idea to try on your next attempt that you’d never thought of before.
That adds up to your “smarts” not being a constant, but varying over time based on some combination of independance and creativity (in thinking up and trying new approaches), ability to avoid bad habits, and ability to learn from mistakes. And if you can’t keep thinking up a reasonable number of new approaches, and at least balance any bad habits you pickup against what you’ve learnt, your effective “smarts” are going to drop dramatically no matter what their original value was. And if that happens, you’re going to quickly find yourself at the s=0.0 line of the graph, which is the only point where even p=1.0 won’t eventually get you across the line.
Considering perseverance a constant isn’t really very accurate either. First there’s psychology — you probably will try a few times, just so you can tell yourself that you didn’t give up immediately; but equally, if you don’t get some sort of early success, you’ll probably give up and move on to something more immediately rewarding too. Hey, it is the era of instant gratification. But on the other hand, if you’ve already had a couple of dozen attempts, you’re probably going to keep trying, in order to avoid having failed all those times for no gain at all. The support (or lack thereof) from family, friends or colleagues will probably vary over time and have an impact as well. Not to mention external impacts, like other people’s successes and failures in the same/similar areas, or other changes to your overall thoughts on whether the project is still worthwhile or not.
All of which turns success into a possibly easier question: can you maintain (or increase) your smarts, and keep going long enough to get out of the blue?
Well, assuming you try in the first place.
[…] n times, that becomes an additional reason not to succeed at attempt n+1. But pfft, we’ve addressed that, […]