Bitcoin Price
One of the things that’s hard to talk sensibly about is Bitcoin’s price. I’m going to have a go at it anyway.
Personally, I think there’s two fundamental aspects driving Bitcoin’s value: adoption, and security. The idea there is that, fundamentally, if you look at each person who’s invested in Bitcoin, take their net worth and multiply it by the percentage of that net worth they’re confident putting in Bitcoin, and add all that up, you’ll get Bitcoin’s market cap. So increased adoption means you have more people to look at, and increased security means each person is willing to put a higher percentage of their net worth into Bitcoin. Both those underlying factors are interesting to me, so I think having some idea of price trends is useful even as technical information. Obviously that doesn’t take competition into account at all — maybe other things look safer than Bitcoin, maybe people change their risk profile and are looking for profit rather than safety, etc: I don’t mean to suggest the above is all there is to it.
But the underlying idea there is that long term sustained increases in Bitcoin’s price have to be supported by sustained long term increases in adoption; and for the price increases to be exponential, the adoption increases probably also have to be exponential: you can’t just get 100 new Bitcoiners each cycle, you have to double the number of Bitcoiners each cycle.
One way to capture that trend is by plotting Bitcoin’s price over time on a logarithmic graph: every time the line on the graph goes up by an inch, that reflects the price going up 10x, and likewise reflects the underlying adoption of Bitcoin going up by some similar factor. The simplest way of doing this and turning it into a prediction is exemplified by the rainbow chart which is calculated by also putting the time since bitcoin began on a logarithmic scale, then picking the best straight line that matches. Again: I don’t mean to suggest that this approaches captures all the important things about price movements; it doesn’t have any way to predict how changes in monetary or asset price inflation might affect the price, nor have any way of capturing competition in the monetary/cryptocurrency space, and at best it can only predict a trend, not shocks to the trend.
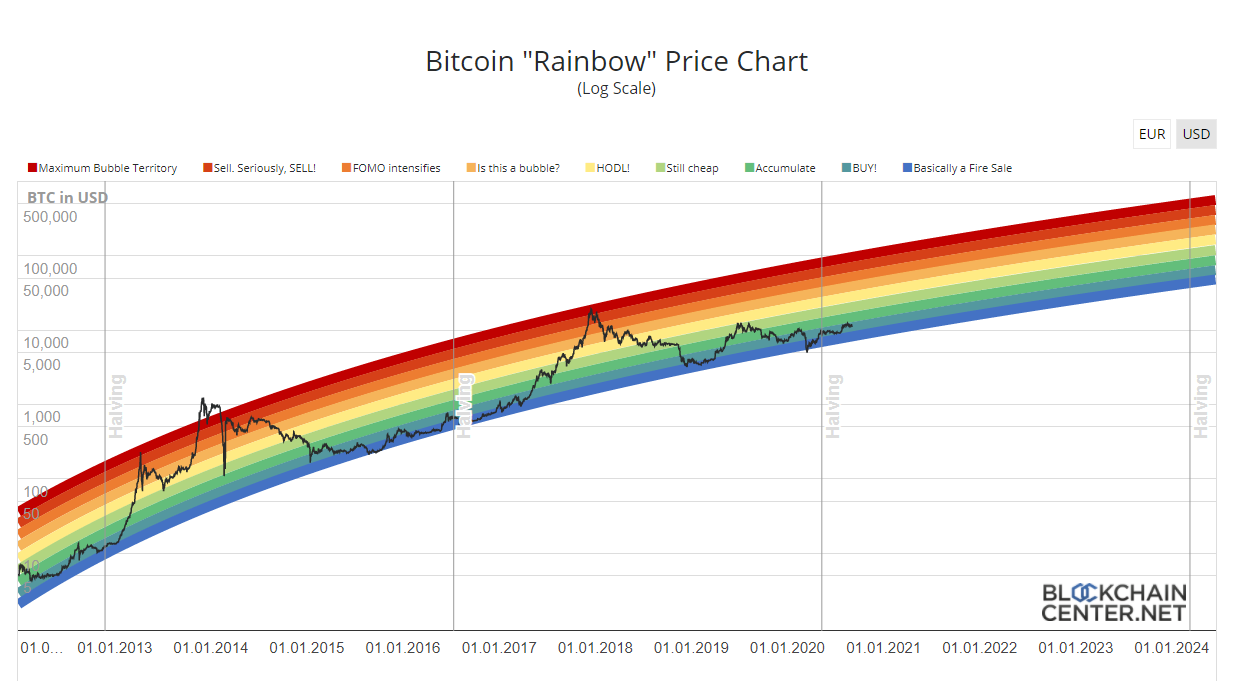
But without some better way of predicting the future, guessing that trends from the past will continue more or less the same doesn’t seem like a bad idea. But if you want to do that, the rainbow chart is kind-of awkward: most of the space for the chart is outside the rainbow, and thus irrelevant if you already think the price will follow the rainbow; and because the rainbow tends to cross a 10x spread in price, and isn’t a straight line, it can be hard to match up when the rainbow is predicting a particular price level will be hit.
One way of fixing that is baking the rainbow prediction in, and seeing what remains. For the following graph, I’m taking the price prediction from bitcointalk user trolololo dated 2017-01-10; I’m dividing the actual price by the prediction, taking the log of that, then rescaling (ie y=log(price/pred, 10)*4+3), and just using time as the x-axis. The rainbow colours are then simple stripes — the border between green and yellow (at y=3) is the line that the price would follow if it had exactly matched the prediction.
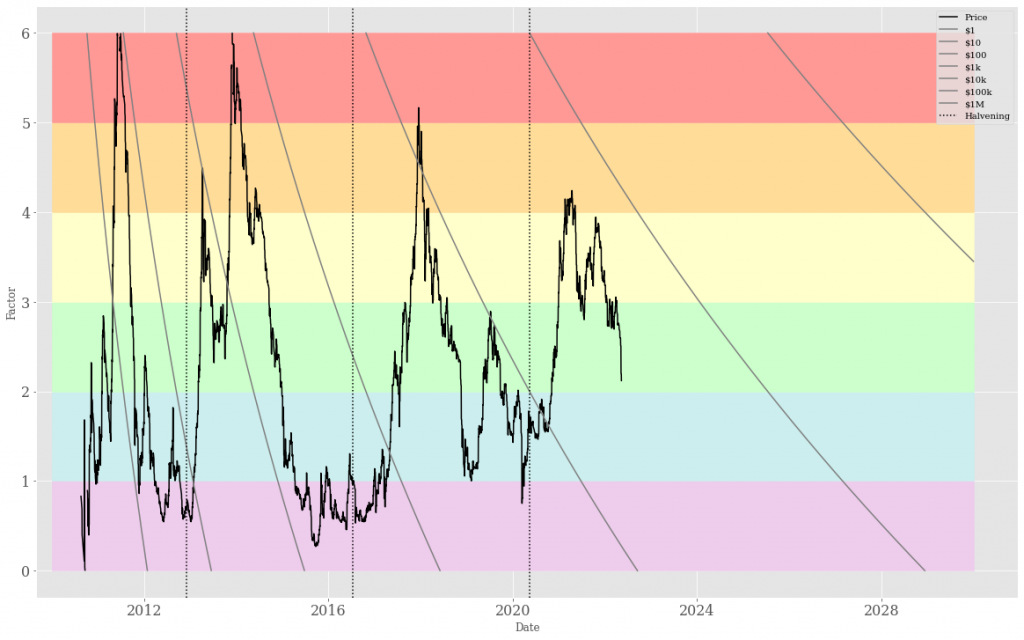
The additional lines marked on the graph are the price points at powers of 10 — $1, $10, $100, etc up to $1,000,000 in the top right corner. You can perhaps see some psychological barriers there — an aversion to crossing the $10, $1000 and $10,000 barriers, with those figures only being crossed after they were in the blue, “cheap”, region of the rainbow prediction.
Again: it’s not reasonable to draw firm conclusions from these sorts of models — the rainbow chart simply models Bitcoin’s past performance, and as companies like to say about stocks, past performance is no guarantee of future results.
But I think it can be reasonable to use it as a baseline, that is with the proviso that things continue growing much as they have been, that there are no enormous shocks, etc, what seems likely to happen? In which case, if crossing the $100,000 barrier is similar to past ones, we probably shouldn’t expect to do it outside of the blue region, which suggests it’s perhaps plausible in 2027, which is another 5 years away; and Bitcoin at a million dollars per coin (hyperbitcoinisation?) is probably still a decade or more away, reachable perhaps sometime in the 2030s. Even $100k being the “fair price” according to the rainbow model appears not to occur until around about 2024.
That is, if you’re saving Bitcoin for your retirement in a decade or three, then buying now and expecting ridiculous gains might be reasonable; but if you’re expecting huge returns over just the next year or two, then that probably implies you’re expecting that Bitcoin grows much faster than it has in its entire history so far, which is a very big call.
I suspect “things continue growing much as they have been” probably already bakes in things like “44 Countries To Meet In El Salvador To Discuss Bitcoin” — we’re already assuming roughly exponential increases in adoption, and going from some companies adding it to their balance sheet to some countries doing the same is simply the scale we’ve already reached. New ETFs or more appropriate accounting standards also seem likely to be effectively baked in to me.
On the other hand, I’m pretty sure a prediction based on a linear regression like that is also effectively assuming that USD monetary policy continues to produce both low inflation in the 1%-2% range, and very low interest rates, since those have both the case for almost all Bitcoin’s existence, and changes there (assuming they’re not “transitory”) will probably cause different behaviours in the future compared to the past. Maybe that results in something meaningful; but maybe it just means that we’d want to redo the charts in “2009 USD” in order to exclude CPI inflation, and that might turn out to be already be good enough.
You can perhaps get a better fitting prediction by redoing the regression; for me, I like that using one that’s about five years old is still useful, and also that it perhaps suggests you shouldn’t take any conclusions you might draw from it too seriously. I don’t think using a fit based on all the price data to date changes any of the conclusions above substantially.