Some Lenny development cycle stats
I’ve been playing with some graphing tools lately, in particular Dan Vanderkam’s dygraphs JavaScript Visualization Library. So far I’ve translated the RC bug list (the “official” one, not the other one) into the appropriate format, generated some numbers for an LD50 equivalent for bugs, and on Wouter’s suggestion the buildd stats.
One of the nice things about the dygraphs library is it lets you dynamically play with the date range you’re interested in; and you can also apply a rolling average to smooth out some of the spikiness in the data. Using that to restrict the above graphs to the lenny development cycle (from etch’s release in April 2007 to lenny’s release in February 2009) gives some interesting stats. Remembering that the freeze started in late July 2008 (Debconf 8 was a couple of weeks later in August 2008).
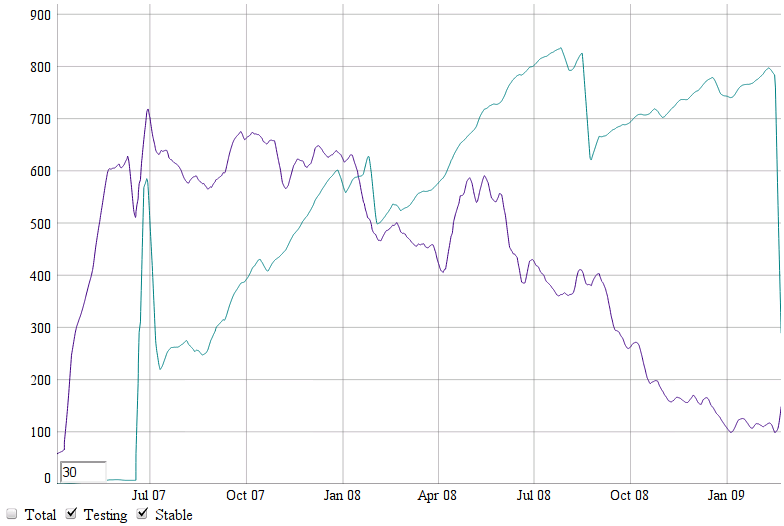
RC bugs; first:
Not sure there’s a lot of really interesting stuff to deduce from that, but there’s a couple of interesting things to note. One is that before the freeze, there were some significant spikes in the bug count — July 2007, September 2007, November 2007, and April 2008, in particular; but after the freeze, the spikes above trend were very minor, both in size and duration. Obviously all of those are trivial in comparison to the initial spurt in bugs between April and June 2007, though. Also interesting is that by about nine months in, lenny had fewer RC bugs than the stable release it was replacing (etch) — and given that’s against a 22 month dev cycle, it’s only 40% of etch’s life as stable. Of course some of that may simply be due to a lack of accuracy in tracking RC bugs in stable; or a lack of accuracy in the RC bugcount software.
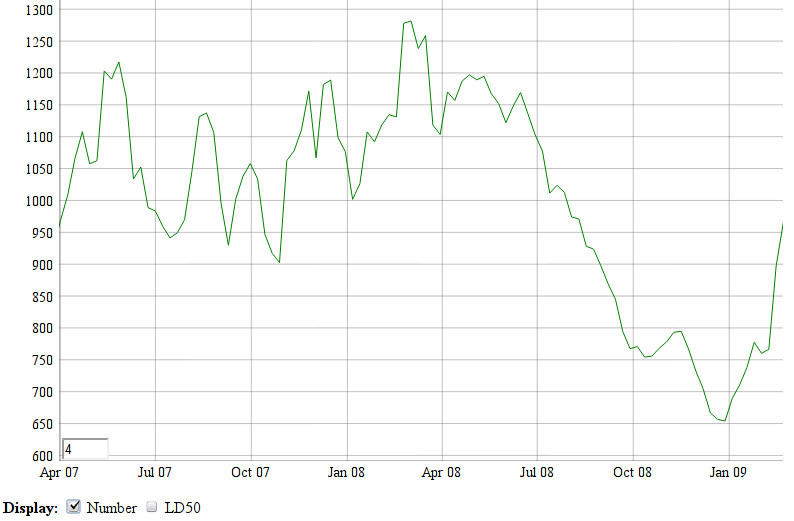
Quite a bit more interesting is the trend of the number of bugs (of all sorts — wishlist, minor, normal, RC, etc) filed each week — it varies quite a bit up until the freeze, but without any particular trend; but pretty much as soon as the freeze is announced trends steadily downward until the release occurs at which point there’s about half as many bugs being filed each week as there were before the freeze. And after lenny’s released it starts going straight back up. There’s a few possible explanations for the cause of that: it might be due to fewer changes being uploaded due to the freeze, and thus less bugs being filed; it might be due to people focussing on fixing bugs rather than finding them; it might be due to something completely unrelated.
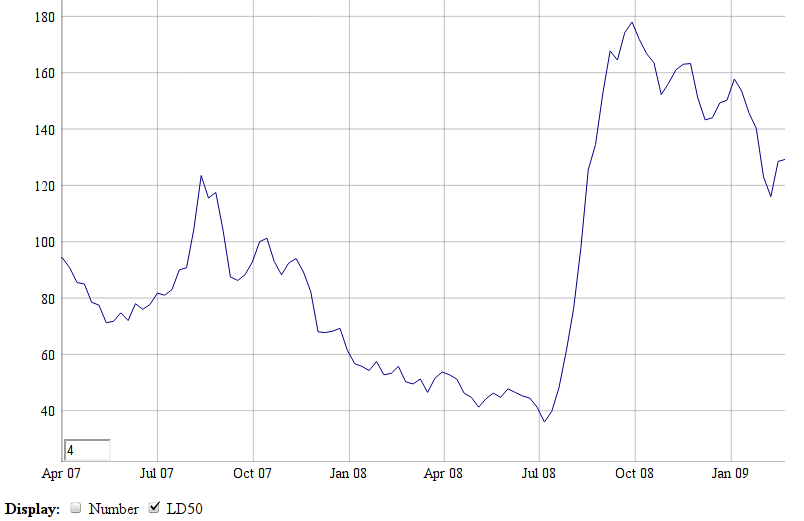
An measure of development activity that I find intriguing is what I’m calling the “LD50” — the median number of days it takes a bug to be closed, or the “lethal dosage of development time for 50% of the bug population”. That’s not the same as a half life, because there’s not necessarily an exponential decay behaviour — I haven’t looked into that at all yet. But it’s a similar idea. Anyway, working out the LD50 for cohorts of bugs filed in each week brings out some useful info. In particular for bugs filed up until the lenny freeze, the median days until a fix ranged from as low as 40 days to up to 120 days; but when the freeze was declared, that shot straight up to 180 days. Since then it’s gradually dropped back down, but it’s still quite high. As far as I can tell, this feature was unique to the lenny release — previous releases didn’t have the same effect, at least to anywhere near that scale. As to the cause — maybe the bugs got harder to fix, or people started prioritising previously filed bugs (eg RC bugs), or were working on things that aren’t tracked in the BTS. But it’s interesting to note that was happening at the same time that fewer bugs were being filed each week — and indeed it suggests an alternative explanation for fewer bugs being filed each week: maybe people noticed that Debian bugs weren’t getting fixed as quickly, and didn’t bother reporting them as often.
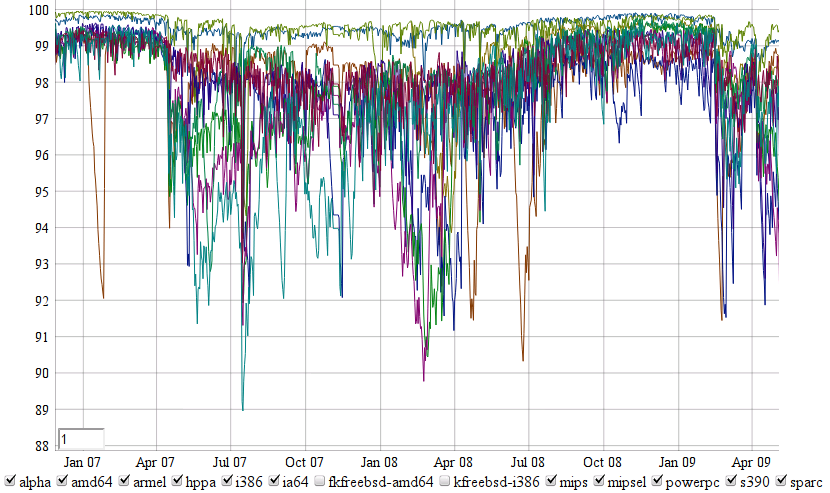
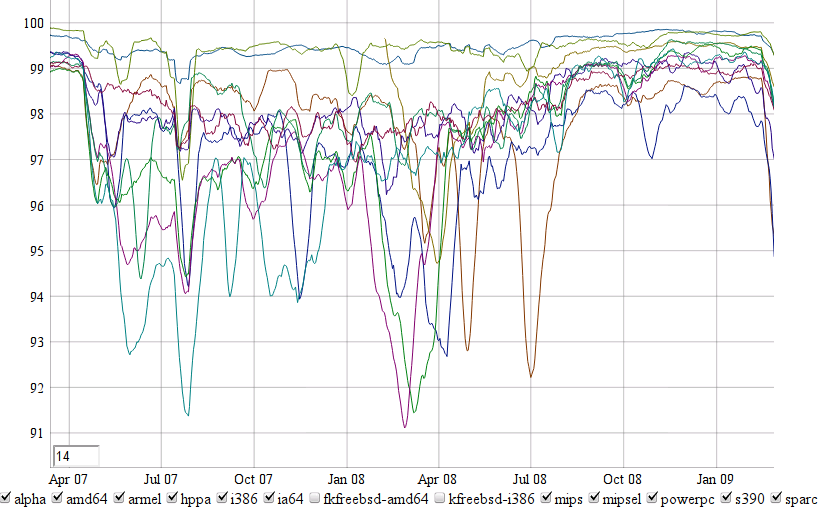
This is a look at the buildd “graph2”, which is each architecture’s percentage of (source) packages that are up to date, out of the packages actually uploaded on that architecture. (The buildd “graph” is similar, but does a percentage of all packages that are meant to be built on the architecture) Without applying the rolling average it’s a bit messy. Doing a rolling average over two weeks makes things much simpler to look at, even if that doesn’t turn out that helpful in this case:
Really the only interesting spots I can see in those graphs are that all the architectures except i386 and amd64 had serious variability in how up to date their builds right up until the freeze — and even then there was still a bit of inconsistency just a few months before the actual release. And, of course, straight after both the etch and lenny release, the proportion of up to date packages for various architectures drops precipitiously.
Interestingly, comparing those properties to the current spot in squeeze’s development seems to indicate things are promising for a release: the buildd up-to-dateness for all architectures looks like it’s stabilised above 98% for a couple of months; the weekly number of bugs filed has dropped down from a high of 1250 a week to about 770 at the moment; and the LD50 has dropped from 170 days shortly after lenny’s freeze to just under 80 days currently (though that’s still quite a bit higher than the 40 days just before lenny’s freeze). The only downside is the RC bug count is still fairly high (at 550), though the turmzimmer RC count is a little better at only 300, currently.
