Bitcoin Fees in History
Prior to Christmas, Rusty did an interesting post on bitcoin fees which I thought warranted more investigation. My first go involved some python parsing of bitcoin-cli results; which was slow, and as it turned out inaccurate — bitcoin-cli returns figures denominated in bitcoin with 8 digits after the decimal point, and python happily rounds that off, making me think a bunch of transactions that paid 0.0001 BTC in fees were paying 0.00009999 BTC in fees. Embarrassing. Anyway, switching to bitcoin-iterate and working in satoshis instead of bitcoin just as Rusty did was a massive improvement.
From a miner’s perspective (ie, the people who run the computers that make bitcoin secure), fees are largely irrelevant — they’re receiving around $11000 USD every ten minutes in inflation subsidy, versus around $80 USD in fees. If that dropped to zero, it really wouldn’t make a difference. However, in around six months the inflation subsidy will halve to 12.5 BTC; which, if the value of bitcoin doesn’t rise enough to compensate, may mean miners will start looking to turn fee income into real money — earning $5500 in subsidy plus $800 from fees could be a plausible scenario, eg (though even that doesn’t seem likely any time soon).
Even so, miners don’t ignore fees entirely even now — they use fees to choose how to fill up about 95% of each block (with the other 5% filled up more or less according to how old the bitcoins being spent are). In theory, that’s the economically rational thing to do, and if the theory pans out, miners will keep doing that when they start trying to get real income from fees rather than relying almost entirely on the inflation subsidy. There’s one caveat though: since different transactions are different sizes, fees are divided by the transaction size to give the fee-per-kilobyte before being compared. If you graph the fee paid by each kB in a block you thus get a fairly standard sort of result — here’s a graph of a block from a year ago, with the first 50kB (the priority area) highlighted:
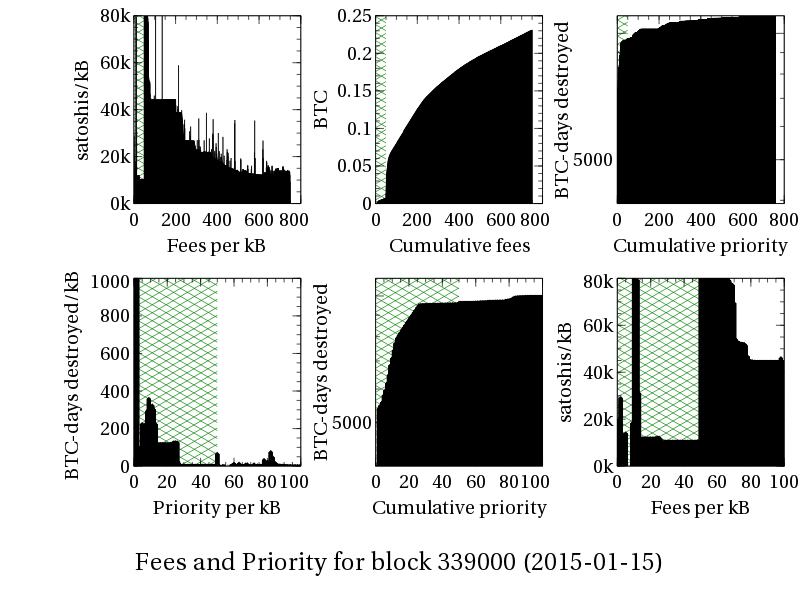
You can see a clear overarching trend where the fee rate starts off high and gradually decreases, with two exceptions: first, the first 50kB (shaded in green) has much lower fees due to mining by priority; and second, there are frequent short spikes of high fees, which are likely produced by high fee transactions that spend the coins mined in the preceeding transaction — ie, if they had been put any earlier in the block, they would have been invalid. Equally, compared to the priority of the first 50kB of transactions, the the remaining almost 700kB contributes very little in terms of priority.
But, as it turns out, bitcoin wallet software often pretty much just tends to pick a particular fee and use it for all transactions no matter the size:
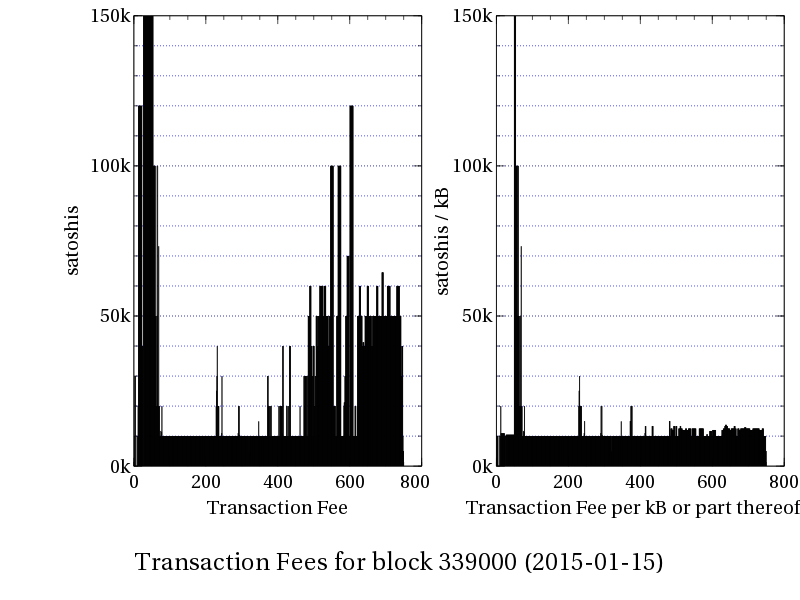
From the left hand graph you can see that, a year ago, wallet software was mostly paying about 10000 satoshi in fees, with a significant minority paying 50000 satoshi in fees — but since those were at the end of the block, which was ordered by satoshis per byte, those transactions were much bigger, so that their fee/kB was lower. This seems to be due to some shady maths: while the straightforward way of doing things would be to have a per-byte fee and multiply that by the transaction’s size in bytes, eg 10 satoshis/byte * 233 bytes gives 2330 satoshi fee; things are done in kilobytes instead, and a rounding mistake occurs, so rather than calculating 10000 satoshis/kilobyte * 0.233 kilobytes, the 0.233 is rounded up to 1kB first, and the result is just 10000 satoshi. The second graph reverses the maths to work out what the fee/kilobyte (or part thereof) figure would have been if this formula was used, and for this particular block, pretty much all the transactions look how you’d expect if exactly that formula was used.
As a reality check, 1 BTC was trading at about $210 USD at that time, so 10000 satoshi was worth about 2.1c at the time; the most expensive transaction in that block, which goes off the scale I’ve used, spent 240000 satoshi in fees, which cost about 50c.
Based on this understanding, we can look back through time to see how this has evolved — and in particular, if this formula and a few common fee levels explain most transactions. And it turns out that they do:
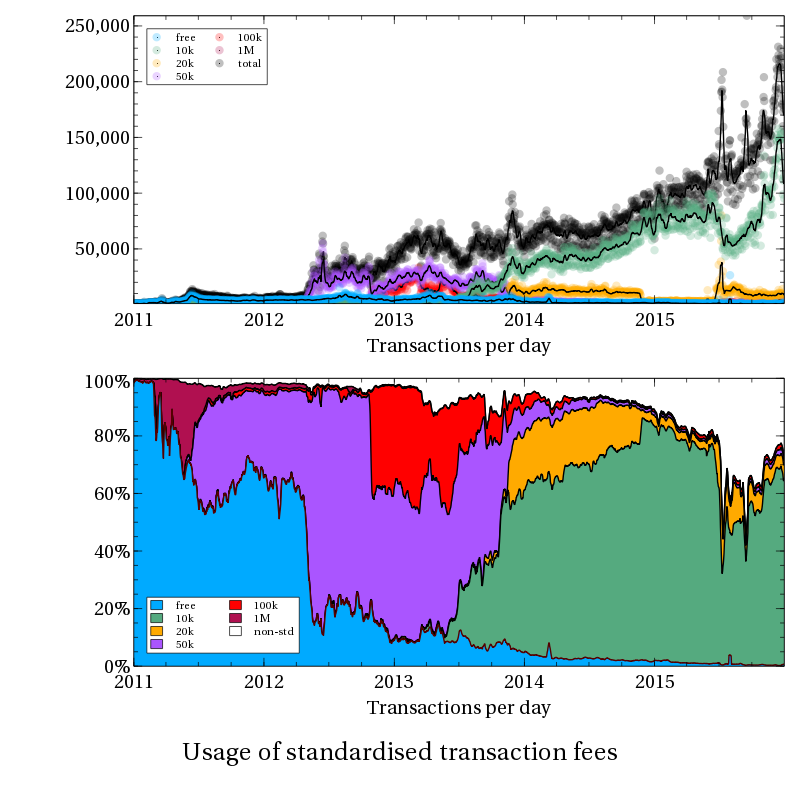
The first graph is essentially the raw data — how many of each sort of fee made it through per day; but it’s not very helpful because bitcoin’s grown substantially. Hence the second graph, which just uses the smoothed data and provides the values in percentage terms stacked one on top of the other. That way the coloured area lets you do a rough visual comparison of the proportion of transactions at each “standard” fee level.
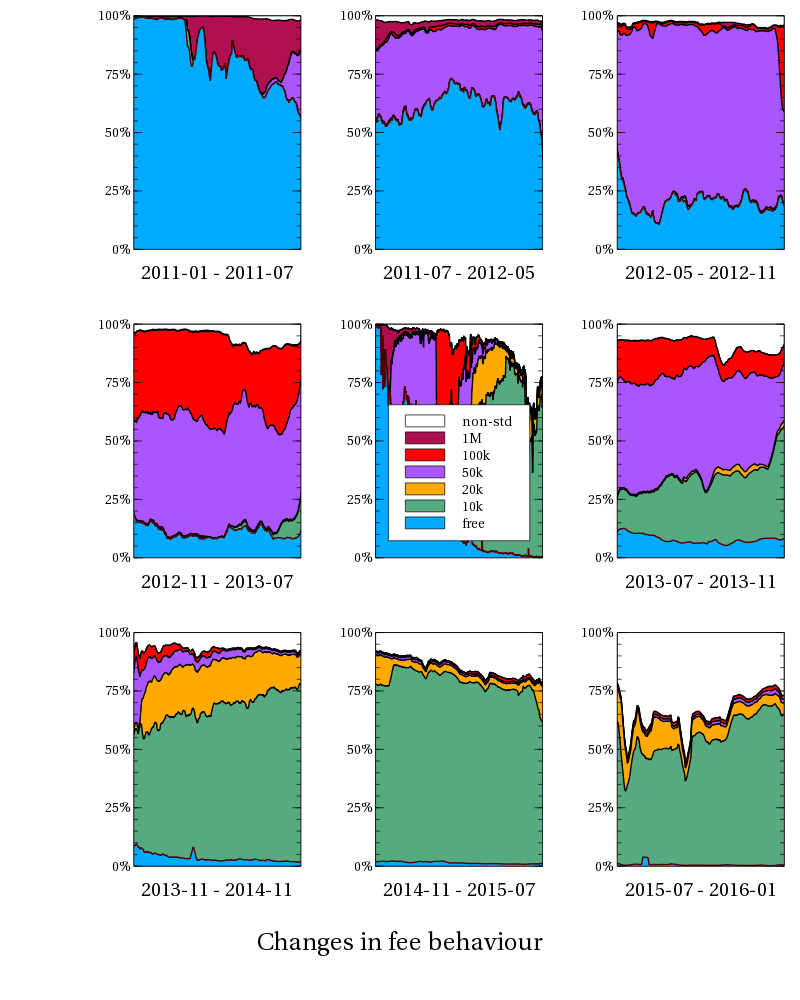
In fact, you can break up that graph into a handful of phases where there is a fairly clear and sudden state change between each phase, while the distribution of fees used for transactions during that phase stays relatively stable:
That is:
- in the first phase, up until about July 2011, fees were just getting introduced and most people paid nothing; fees began at 1,000,000 satoshi (0.01 BTC) (v 0.3.21) before setting on a fee level of 50000 satoshi per transaction (0.3.23).
- in the second phase, up until about May 2012, maybe 40% of transactions paid 50000 satoshi per transaction, and almost everyone else didn’t pay anything
- in the third phase, up until about November 2012, close to 80% of transactions paid 50000 satoshi per transaction, with free transactions falling to about 20%.
- in the fourth phase, up until July 2013, free transactions continue to drop, however fee paying transactions split about half and half between paying 50000 satoshi and 100000 satoshi. It looks to me like there was an option somewhere to double the default fee in order to get confirmed faster (which also explains the 20000 satoshi fees in future phases)
- in the fifth phase, up until November 2013, the 100k satoshi fees started dropping off, and 10k satoshi fees started taking over (v 0.8.3)
- in the sixth phase, the year up to November 2014, transactions paying fees of 50k and 100k and free transactions pretty much disappeared, leaving 75% of transactions paying 10k satoshi, and maybe 15% or 20% of transactions paying double that at 20k satoshi.
- in the seventh phase, up until July 2015, pretty much everyone using standard fees had settled on 10k satoshi, but an increasing number of transactions started using non-standard fees, presumably variably chosen based on market conditions (v 0.10.0)
- in the eighth phase, up until now, things go a bit haywire. What I think happened is the “stress tests” in July and September caused the number of transactions with variable fees to spike substantially, which caused some delays and a lot of panic, and that in turn caused people to switch from 10k to higher fees (including 20k), as well as adopt variable fee estimation policies. However over time, it looks like the proportion of 10k transactions has crept back up, presumably as people remove the higher fees they’d set by hand during the stress tests.
Okay, apparently that was part one. The next part will take a closer look at the behaviour of transactions paying non-standard fees over the past year, in particular to see if there’s any responsiveness to market conditions — ie prices rising when there’s contention, or dropping when there’s not.
[…] http://www.erisian.com.au/wordpress/2016/01/07/bitcoin-fees-in-history http://www.cointape.com/#fees […]
[…] BITCOIN FEES IN HISTORYÂ [erisian.com.au] […]
[…] from my previous post on historical Bitcoin fees… Obviously history is fun and all, but it’s safe to say that working out what’s […]
[…] Towns followed up on Rusty’s post with more in-depth analysis. He identified eight distinct fee market phases over the course of bitcoin’s […]