Bitcoin Fees vs Supply and Demand
Continuing from my previous post on historical Bitcoin fees… Obviously history is fun and all, but it’s safe to say that working out what’s going on now is usually far more interesting and useful. But what’s going on now is… complicated.
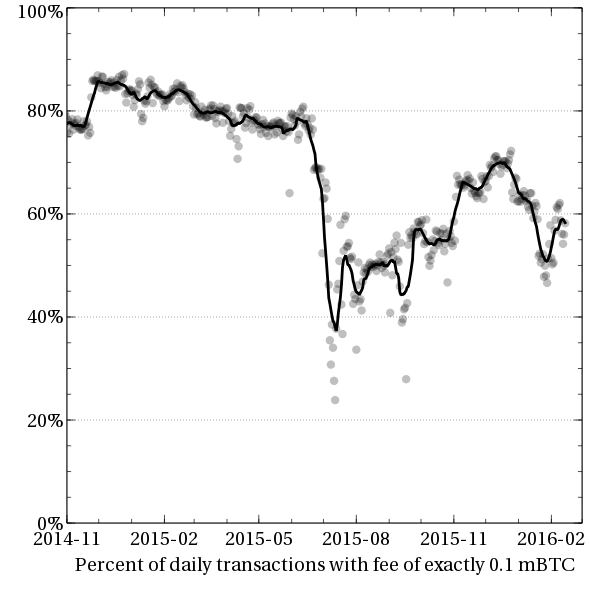
First, as was established in the previous post, most transactions are still paying 0.1 mBTC in fees (or 0.1 mBTC per kilobyte, rounded up to the next kilobyte).
Again, as established in the previous post, that’s a fairly naive approach: miners will fill blocks with the smallest transactions that pay the highest fees, so if you pay 0.1 mBTC for a small transaction, that will go in quickly, but if you pay 0.1 mBTC for a large transaction, it might not be included in the blockchain at all.
It’s essentially like going to a petrol station and trying to pay a flat $30 to fill up, rather than per litre (or per gallon); if you’re riding a scooter, you’re probably over paying; if you’re driving an SUV, nobody will want anything to do with you. Pay per litre, however, and you’ll happily get your tank filled, no matter what gets you around.
But back in the bitcoin world, while miners have been using the per-byte approach since around July 2012, as far as I can tell, users haven’t really even had the option of calculating fees in the same way prior to early 2015, with the release of Bitcoin Core 0.10.0. Further, that release didn’t just change the default fees to be per-byte rather than (essentially) per-transaction; it also dynamically adjusted the per-byte rate based on market conditions — providing an estimate of what fee is likely to be necessary to get a confirmation within a few blocks (under an hour), or within ten or twenty blocks (two to four hours).
There are a few sites around that make these estimates available without having to run Bitcoin Core yourself, such as bitcoinfees.21.co, or bitcoinfees.guthub.io. The latter has a nice graph of recent fee rates:
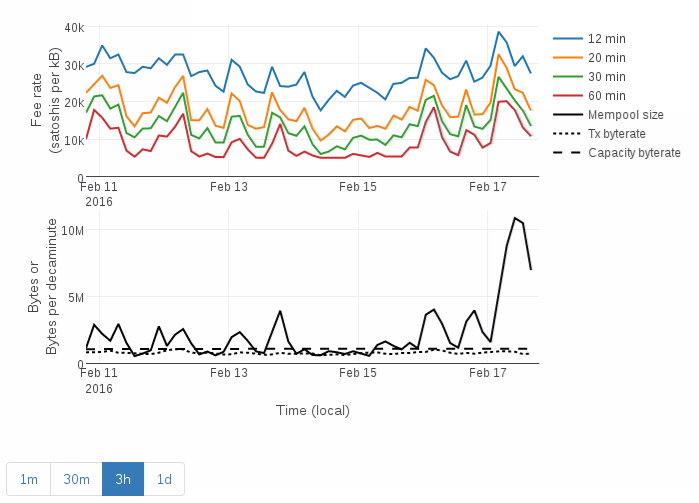
You can see from this graph that the estimated fee rates vary over time, both in the peak fee to get a transaction confirmed as quickly as possible, and in how much cheaper it might be if you’re willing to wait.
Of course, that just indicates what you “should” be paying, not what people actually are paying. But since the blockchain is a public ledger, it’s at least possible to sift through the historical record. Rusty already did this, of course, but I think there’s a bit more to discover. There’s three ways in which I’m doing things differently to Rusty’s approach: (a) I’m using quantiles instead of an average, (b) I’m separating out transactions that pay a flat 0.1 mBTC, (c) I’m analysing a few different transaction sizes separately.
To go into that in a little more detail:
- Looking at just the average values doesn’t seem really enlightening to me, because it can be massively distorted by a few large values. Instead, I think looking at the median value, or even better a few percentiles is likely to work better. In particular I’ve chosen to work with “sextiles”, ie the five midpoints you get when splitting each day’s transactions into sixths, which gives me the median (50%), the tertiles (33% and 66%), and two additional points showing me slightly more extreme values (16.7% and 83.3%).
- Transactions whose fees don’t reflect market conditions at all, aren’t really interesting to analyse — if there are enough 0.1 mBTC, 200-byte transactions to fill a block, then a revenue maximising miner won’t mine any 400-byte transactions that only pay 0.1 mBTC, because they could fit two 200-byte transactions in the same space and get 0.2 mBTC; and similarly for transactions of any size larger than 200-bytes. There’s really nothing more to it than that. Further, because there are a lot of transactions that are essentially paying a flat 0.1 mBTC fee, they make it fairly hard to see what the remaining transactions are doing — but at least it’s easy to separate them out.
- Because the 0.10 release essentially made two changes at once (namely, switching from a hardcoded default fee to a fee that varies on market conditions, and calculating the fee based on a per-byte rate rather than essentially a per-transaction rate) it can be hard to see which of these effects are taking place. By examining the effect on transactions of a particular size, we can distinguish the effects however: using a per-transaction fee will result in different transactions sizes paying different per-byte rates, while using per-byte fee will result in the transactions of different sizes harmonising at a particular rate. Similarly, using fee estimation will result in the fees for a particular transaction size varying over time; whereas the average fee rate might vary over time simply due to using per-transaction fees while the average size of transactions varies. I’ve chosen four sizes: 220-230 bytes which is the size of a transaction spending a single, standard, pay-to-public-key-hash (P2PKH) input (with a compressed public key) to two P2PKH outputs; 370-380 bytes which matches a transaction spending two P2PKH inputs to two P2PKH outputs; 520-520 bytes which matches a transaction spending three P2PKH inputs to two P2PKH inputs, and 870-1130 bytes which catches transactions around 1kB.
The following set of graphs take this approach, with each transaction size presented as a separate graph. Each graph breaks the relevant transactions into sixths, selecting the sextiles separating each sixth — each sextile is then smoothed over a 2 week period to make it a bit easier to see.
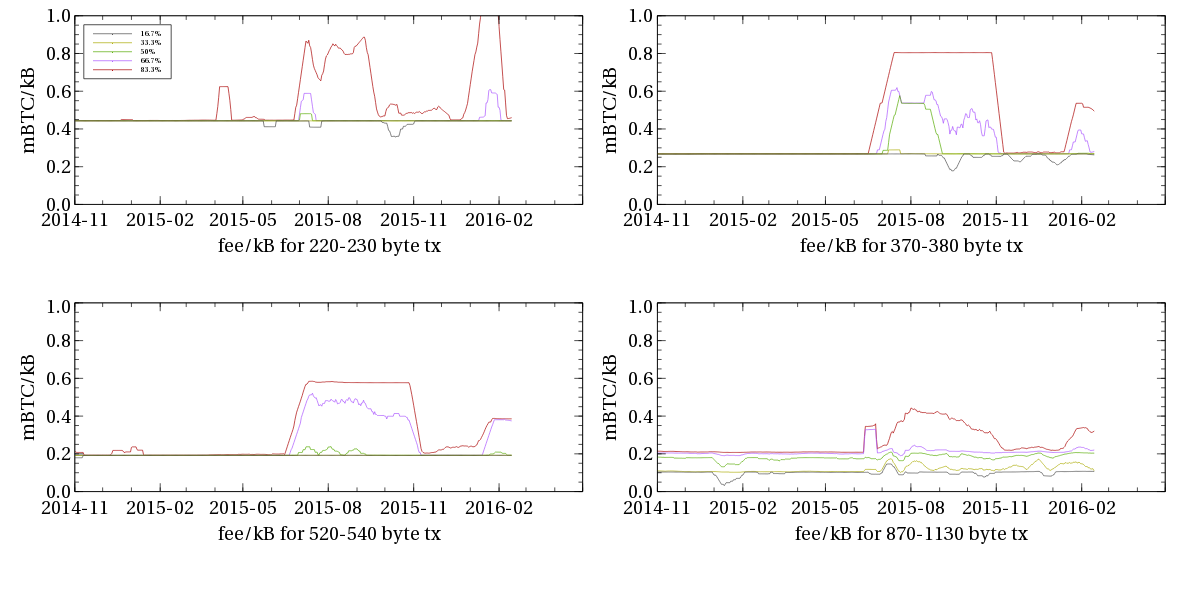
We can make a few observations from this (click the graph to see it at full size):
- We can see that prior to June 2015, fees were fairly reliably set at 0.1 mBTC per kilobyte or part thereof — so 220B transactions paid 0.45 mBTC/kB, 370B transactions paid 0.27 mBTC/kB, 520B transactions paid 0.19 mBTC/kB, and transactions slightly under 1kB paid 0.1 mBTC/kB while transactions slightly over 1kB paid 0.2 mBTC/kB (the 50% median line in between 0.1 mBTC/kB and 0.2 mBTC/kB is likely an artifact of the smoothing). These fees didn’t take transaction size into account, and did not vary depending on market conditions — so they did not reflect changes in demand, how full blocks were, the price of Bitcoin in USD, the hashpower used to secure the blockchain, or any similar factors that might be relevant.
- We can very clearly see that there was a dramatic response to market conditions in late June 2015 — and not coincidentally this was when the “stress tests” or “flood attack” occurred.
- It’s also pretty apparent the market response here wasn’t actually very rational or consistent — eg 220B transactions spiked to paying over 0.8 mBTC/kB, while 1000B transactions only spiked to a little over 0.4 mBTC/kB — barely as much as 220B transactions were paying prior to the stress attack. Furthermore, even while some transactions were paying significantly higher fees, transactions paying standard fees were still going through largely unhindered, making it questionable whether paying higher fees actually achieved anything.
- However, looking more closely at the transactions with a size of around 1000 bytes, we can also see there was a brief period in early July (possibly a very brief period that’s been smeared out due to averaging) where all of the sextiles were above the 0.1 mBTC/kB line — indicating that there were some standard fee paying transactions that were being hindered. That is to say that it’s very likely that during that period, any wallet that (a) wasn’t programmed to calculate fees dynamically, and (b) was used to build a transaction about 1kB in size, would have produced a transaction that would not actually get included in the blockchain. While it doesn’t meet the definition laid out by Jeff Garzik, I think it’s fair to call this a “fee event”, in that it’s an event, precipitated by fee rates, that likely caused detectable failure of bitcoin software to work as intended.
- On the other hand, it is interesting to notice that a similar event has not yet reoccurred since; even during later stress attacks, or Black Friday or Christmas shopping rushes.
As foreshadowed, we can redo those graphs with transactions paying one of the standard fees (ie exactly 0.1 mBTC, 0.01 mBTC, 0.2 mBTC, 0.5 mBTC, 1m BTC, or 10 mBTC) removed:
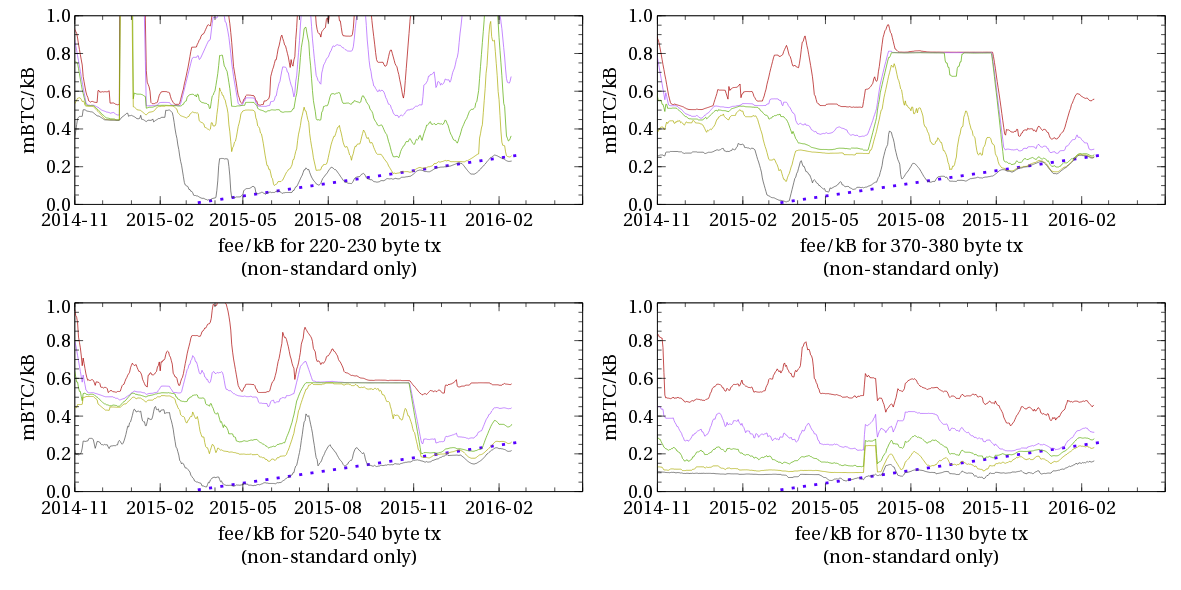
As before, we can make a few observations from these graphs:
- First, they’re very messy! That is, even amongst the transactions that pay variable fees, there’s no obvious consensus on what the right fee to pay is, and some users are paying substantially more than others.
- In early February, which matches the release of Bitcoin Core 0.10.0, there was a dramatic decline in the lowest fees paid — which is what you would predict if a moderate number of users started calculating fees rather than using the defaults, and found that paying very low fees still resulted in reasonable confirmation times. That is to say, wallets that dynamically calculate fees have substantially cheaper transactions.
- However, those fees did not stay low, but have instead risen over time — roughly linearly. The blue dotted trend line is provided as a rough guide; it rises from 0 mBTC/kB on 1st March 2015, to 0.27 mBTC/kB on 1st March 2016. That is, market driven fees have roughly risen to the same cost per-byte as a 2-input, 2-output transaction, paying a flat 0.1 mBTC.
At this point, it’s probably a good idea to check that we’re not looking at just a handful of transactions when we remove those paying standard 0.1 mBTC fees. Graphing the number of transactions per day of each type (ie, total transactions, 220 byte transactions (1-input, 2-output), 370 byte transactions (2-input, 2-output), 520 byte transactions (3-input, 2-output), and 1kB transactions shows that they all increased over the course of the year, and that there are far more small transactions than large ones. Note that the top-left graph has a linear y-axis; while the other graphs use a logarithmic y-axis — so that each step in the vertical indicates a ten-times increase in number of transactions per day. No smoothing/averaging has been applied.
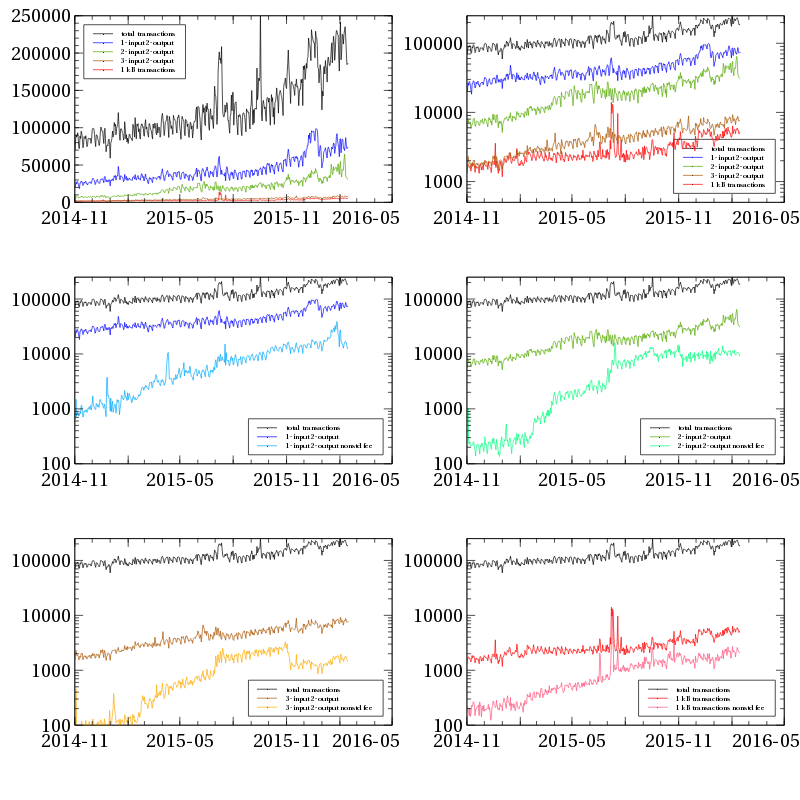
We can see from this that by and large the number of transactions of each type have been increasing, and that the proportion of transactions paying something other than the standard fees has been increasing. However it’s also worth noting that the proportion of 3-input transactions using non-standard fees actually decreased in November — which likely indicates that many users (or the maintainers of wallet software used by many users) had simply increased the default fee temporarily while concerned about the stress test, and reverted to defaults when the concern subsided, rather than using a wallet that estimates fees dynamically. In any event, by November 2015, we have at least about a thousand transactions per day at each size, even after excluding standard fees.
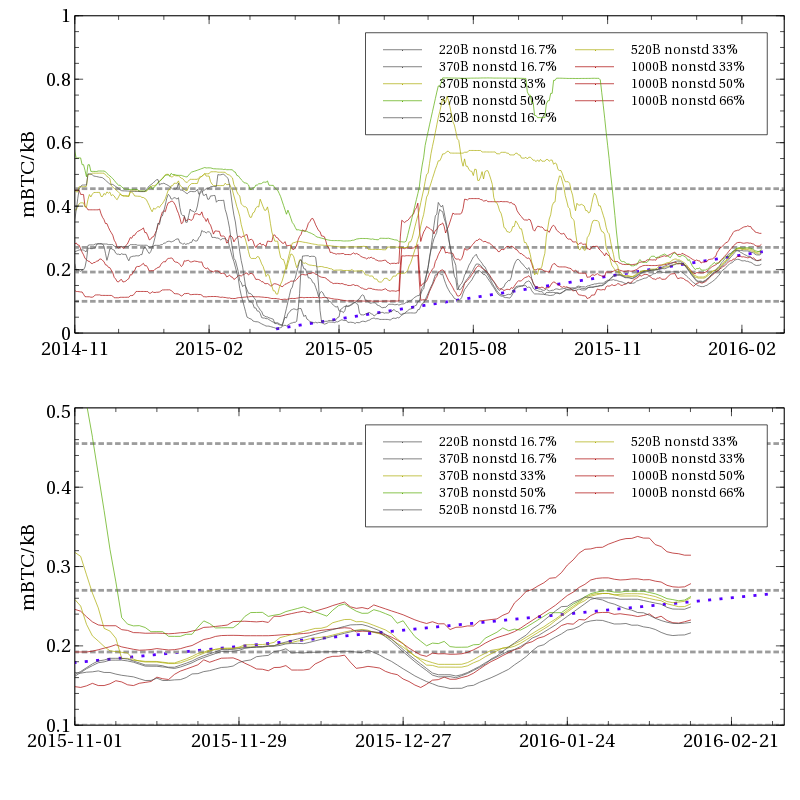
If we focus on the sextiles that roughly converge to the trend line we used earlier, we can, in fact make a very interesting observation: after November 2015, there is significant harmonisation on fee levels across different transaction sizes, and that harmonisation remains fairly steady even as the fee level changes dynamically over time:
Observations this time?
- After November 2015, a large bunch of transactions of difference sizes were calculating fees on a per-byte basis, and tracking a common fee-per-byte level, which has both increased and decreased since then. That is to say, a significant number of transactions are using market-based fees!
- The current market rate is slightly lower than the what a 0.1 mBTC, 2-input, 2-output transaction is paying (ie, 0.27 mBTC/kB).
- The recent observed markets rate correspond roughly to the 12-minute or 20-minute fee rates in the bitcoinfees graph provided earlier. That is, paying higher rates than the observed market rates is unlikely to result in quicker confirmation.
- There are many transactions paying significantly higher rates (eg, 1-input 2-output transactions paying a flat 0.1 mBTC).
- There are also many transactions paying lower rates (eg, 3-input 2-output transactions paying a flat 0.1 mBTC) that can expect delayed confirmation.
Along with the trend line, I’ve added four grey, horizontal guide lines on those graphs; one at each of the standard fee rates for the transaction sizes we’re considering (0.1 mBTC/kB for 1000 byte transactions, 0.19 mBTC/kB for 520 byte transactions, 0.27 mBTC/kB for 370 byte transactions, and 0.45 mBTC/kB for 220 byte transactions).
An interesting fact to observe is that when the market rate goes above any of the grey dashed lines, then transactions of the corresponding size that just pay the standard 0.1 mBTC fee become now less profitable to mine than transactions that pay the fees at the market rate. In a very particular sense this will induce a “fee event”, of the type mentioned earlier. That is, with the fee rate above 0.1 mBTC/kB, transactions of around 1000 bytes that pay 0.1 mBTC will generally suffer delays. Following the graph, for the transactions we’re looking at there have already been two such events — a fee event in July 2015, where 1000 byte transactions paying standard fees began getting delayed regularly due to the market fees began exceeding 0.1 mBTC/kB (ie, the 0.1 mBTC fee divided by 1 kB transaction size); and following that a second fee event during November impacting 3-input, 2-output transactions, due to market fees exceeding 0.19 mBTC/kB (ie, 0.1 mBTC divided by 0.52 kB). Per the graph, a few of the trend lines are lingering around 0.27 mBTC/kB, indicating a third fee event is approaching, where 370 byte transactions (ie 2-input, 2-output) paying standard fees will start to suffer delayed confirmations.
However the grey lines can also be considered as providing “resistance” to fee increases — for the market rate to go above 0.27 mBTC/kB, there must be more transactions attempting to pay the market rate than there were 2-input, 2-output transactions paying 0.1 mBTC. And there were a lot of those — tens of thousands — which means market fees will only be able to increase with higher adoption of software that calculates fees using dynamic estimates.
It’s not clear to me why fees harmonised so effectively as of November; my best guess is that it’s just the result of gradually increasing adoption, accentuated by my choice of quantiles to look at, along with averaging those results over a fortnight. At any rate, most of the interesting activity seems to have taken place around August:
- Bitcoin Core 0.11.0 came out in July with some minor fee estimation improvements.
- Electrum came out with dynamic fees in 2.4.1 in August.
- Copay (by bitpay) adder dynamic fees in 1.1.3 in August.
- Mycelium added per-byte fees in 2.5.8 in December.
Of course, obviously many wallets still don’t do per-byte, dynamic fees as far as I can tell:
- Blockchain.info just defaults to 0.1 mBTC as far as I can tell, the API seems to require a minimum fee of 0.1 mBTC
- coinbase.com pays 0.3 mBTC per transaction (from what I’ve seen, they tend to use 3-input, 3-output transactions, which presumably means about 600 bytes per transaction for a rate of perhaps 0.5 mBTC/kB)
- Airbitz seems to choose a fee based on transaction amount rather than transaction size
- myTrezor seems have a default 0.1 mBTC fee, that can optionally be raised to 0.5 mBTC
- bitcoinj does not do per-byte fees, or calculate fees dynamically (although an app based on bitcoinj might do so)
Summary
- Many wallets still don’t calculate fees dynamically, or even calculate fees at a per-byte level.
- A significant number of wallets are dynamically calculating fees, at a per-byte granularity
- Wallets that dynamically calculate fees pay substantially lower fees than those that don’t
- Paying higher than dynamically calculated market rates generally will not get your transaction confirmed any quicker
- Market-driven fees have risen to about the same fee level that wallets used for 2-input, 2-output transactions at the start of 2015
- Market-driven fees will only be able to rise further with increased adoption of wallets that support market-driven fees.
- There have been two fee events for wallets that don’t do market based fees, and paid a flat fee of 0.1 mBTC already. For those wallets, since about July 2015, fees have been high enough to cause transactions near 1000 bytes to have delayed confirmations; and since about November 2015, fees have been high enough to cause transactions above 520 bytes (ie, 3-input, 2-output) to be delayed. A third fee event is very close, affecting transactions above 370 bytes (ie, 2-input, 2-output).